How many tests can we run?
This is an aggregate of all I have on the knowledge base for “sample size calculation” and “test capacity estimation.”
We can run up to two tests per month. One sitewide with confidence and another if we group this page template.
This was my answer to the Product Manager’s question.
There are a couple of ways to reach the answer. I will show you three different.
This question first came to me while navigating through the agency ranks at Ladder.io. Our CEO wanted a test capacity estimation in preparation for a client call.
At the time, I had very little intuition to answer and the statistical procedures were blurry. I didn’t know yet. Now I do, and it’s simple, but it can get complex.
Considering you have the right inputs, in 10 minutes or so you’ll have your answer.
If not, you’ll know the steps to get there and what groundwork to cover.
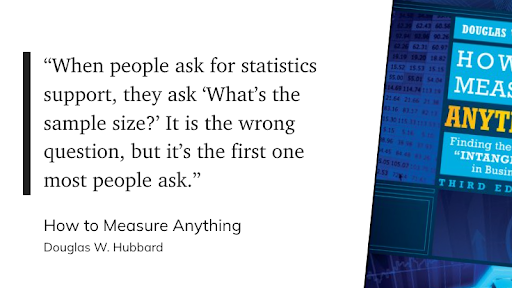
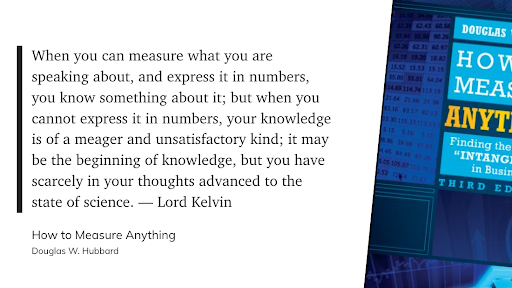
Hubbard’s reference to Barry Nussbaum chief statistician at the Environmental Protection Agency (EPA)
Related: What Is Data-Driven Marketing?
Who’s this post for? Will I get value from this?
Data savvy experimenters and marketeers looking to answer a specific question for their experimentation programs.
I received positive feedback from data analysts and conversion specialists.
Don’t like the numbers discussion? I understand.
Please share with someone in your team that would get value from it and hopefully help you clarify test design and analysis 🚀
The 6 questions answered:
For exercises like this, I like to look back and codify all the questions I was able to answer throughout the process so it becomes a playbook.
Here are the ones I took note of:
- When do we need to know test capacity?
- What do we need to start estimating sample size?
- First-principles, what are we trying to do exactly?
- Percentage or continuous metrics?
- Online calculators, spreadsheets, or formulas?
- Test capacity, why does it matter?

When do we need to know test capacity?

Positive John, Growth Experiments ConsultantTest capacity is the number of tests the product unit could run per month.
From my experience, “How many tests can I run?” appeared mostly for auditing purposes on the agency side and during ideation and prioritization on the product side.
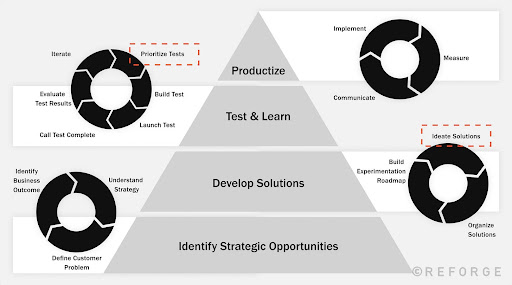
Reforge process for scalable strategic experimentation
So we’re either:
- Supporting a Product Leader about how viable a test they have in mind is in terms of time duration;
- Estimating how many experiments a product could run per month;
- Designing an experiment to set in the agenda when to check test results;
- Understanding experiment viability when considering traffic vs MDE;
- Thinking about prioritizing one test over another.
A brief discussion about experimentation stages
Positive John, Growth Experiments ConsultantExperimentation stages the different steps that a team must go through from idea to decision.
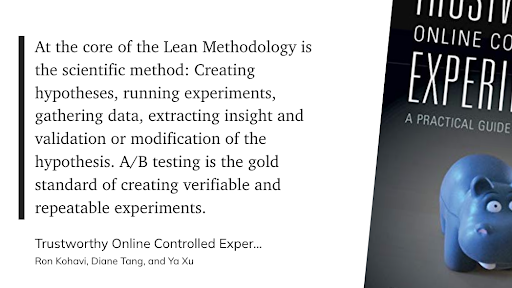
Experimentation at its core is the application of the scientific method to answer relevant business questions.
Relevant in this scope means to reach a decision, resolution after consideration, that carries inherent risk, e.g., financial or public relations damage.
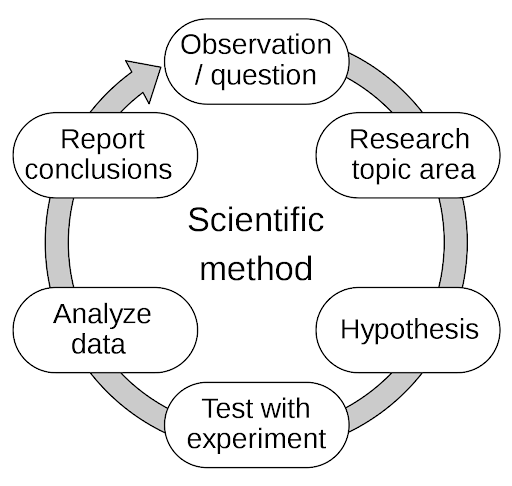
The scientific method starts with a relevant question
The process in eight steps:
- Define a question;
- Gather information, resources, and evidence (observe);
- Form an explanatory hypothesis for a potential change;
- Test the hypothesis by performing an experiment and collecting data;
- Analyze the data;
- Interpret the data and draw conclusions that serve as a starting point for a new hypothesis;
- Communicate results;
- Retest for reproducibility (frequently done by other scientists).
Under this frame, sample size is calculated between steps 3 and 4.
Related: The Data Science/AI Product Owner’s Tool Kit
What do we need to start estimating sample size?
Positive John, Growth Experiments ConsultantThe reasoning and calculations below assume a frequentist design to test analysis. More on this in the Bayesian vs. Frequentist section at the end.
First-principles, what are we trying to do exactly?
- We want to understand how many samples are needed,
- so we know how long to keep an experiment running,
- so we’re confident in our ability to detect a pre-set minimum effect between control and variant with a certain confidence.
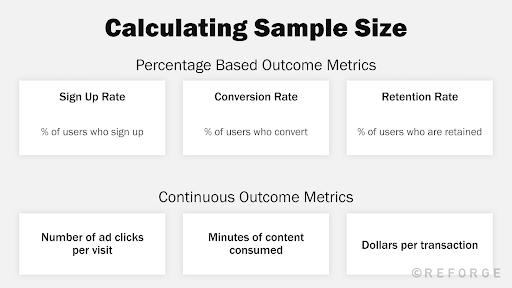
Percentage or continuous metrics?
The sample size is calculated differently if your metric is a proportion of if it’s a continuous metric.
What are the components of test capacity?
General inputs
- Overall evaluation criterion (OEC) and its baseline
- Minimum Detectable Effect (MDE)
- Confidence level (α) and Statistical Power (β)
- Number of variants to be tested (N)
Percentage base metrics inputs
- Weekly Active “Net” Users (WAnU)
Continuous metrics inputs
- Baseline standard deviation (σ)
1. Overall evaluation criterion (OEC)
Defining your primary metric is the starting point for sample size calculation.
OEC is the set of metrics and decision criteria used to judge the outcomes of A/B tests – which is predictive of long-term business and customer value and sensitive to the changes being tested.
Some OEC examples in places I worked:
- conversion to sign-up;
- conversion to product purchase;
- conversion to partner link click;
- conversion to wallet funded;
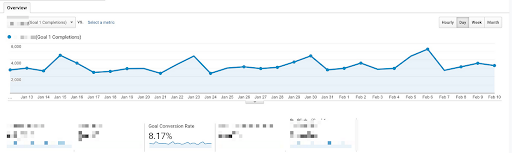
OEC Baseline
Now that you clarified your OEC, you must reach a baseline that you will use for the next calculations.
There are two possible scenarios:
- Set it equal to the historical metric performance
- Estimate based on projections
For example, if using option 1 we would set the baseline for this OEC at 8.17%
When to estimate on projections?
When there’s no historical data available you will estimate the baseline metric based on projections.
It’s not optimal, not exact, but it’s the best you have to play with. Your sample size will be an estimate.
Positive John, Growth Experiments ConsultantTrigger question: For the experience you want to optimize, what’s the best metric to measure in the short term that correlates to business success in the long term?
Full definition from Analytics Toolkit 👉🏼 What does “Overall Evaluation Criterion” mean?
2. Minimum Detectable Effect (MDE)
MDE is the smallest improvement you are willing to be able to detect. It determines how “sensitive” an experiment is.
Positive John, Growth Experiments Consultant👍🏼 Rule of thumb: The lower the baseline for your OEC the more samples you will need to get statistical significance.
I’ve worked with some teams that had some boundaries around determining MDEs to determine how “difficult” the experiment is:
- 1 % is considered simple
- 5 % medium
- >= 7% hard
I like to think about this spectrum using Reforge’s portfolio approach to a testing backlog. If the test is a big bet, you’re expecting a big change in the MDE.
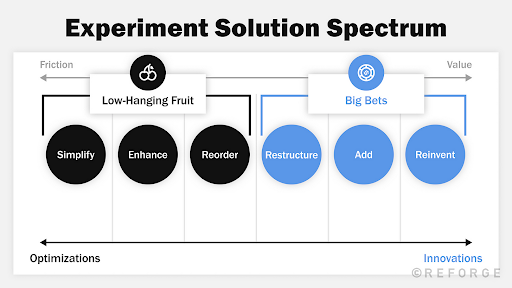
Experiments and investors think similarly when placing bets and managing risks.
Trigger question: How big of a difference actually matters to us from a business perspective? In other words, what change of the OEC is practically significant?
Full definition from Analytics Toolkit 👉🏼 What does “Minimum Detectable Effect” mean?
3. Confidence level (α) and Statistical Power (β)
Positive John, Growth Experiments Consultant👍🏼 Rule of thumb: 95% Confidence level and 80% Statistical Power.
I won’t try to give in-depth definitions for confidence level or statistical power.
Both Ronny and Georgi have done a much better job already, so I’m standing on the shoulders of giants.
A confidence level is a measure of the coverage probability of a confidence interval. The confidence level represents how often the confidence interval should contain the true Treatment effect. There is a duality between p-values and confidence intervals.
Full definition from Analytics Toolkit 👉🏼 What does “Confidence Level” mean?
The statistical power of an A/B test refers to the test’s sensitivity to certain magnitudes of effect sizes. More precisely, it is the probability of observing a statistically significant result at level alpha (α) if a true effect of a certain magnitude is in fact present.
Full definition from Analytics Toolkit 👉🏼 What does “Statistical Power” mean?
4. Number of variants to be tested (N)
Georgi summarizes the reason why perfectly on Analytics Toolkit’s Sample Size calculator page.
Positive John, Growth Experiments ConsultantTests with more than one variant versus a control need to be analyzed with special methods that account for the multiple comparisons problem that otherwise arises. The appropriate p-value and confidence interval correction is the Dunnett’s correction which means that a sample size calculation should take these corrections into account.
5. Weekly Active “Net” Users (WAnU)
Positive John, Growth Experiments ConsultantYour net traffic is not only the users eligible for the test but the users count that historically view or interact with the page template or feature you’re trying to improve.
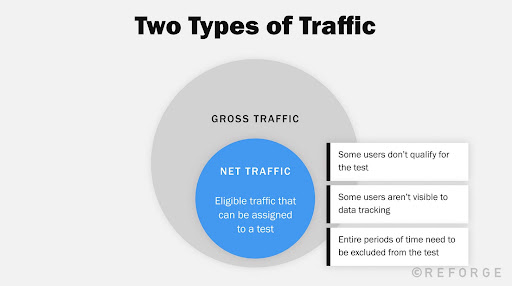
There is no silver bullet answer, every case needs to be assessed individually.
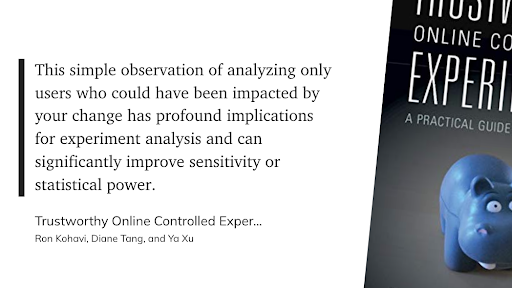
Here are some examples I have on my knowledge base from experience and from Chapter 20, Triggering for Improved Sensitivity, of Trustworthy Controlled Experiments:
- If improving the search page results: Net traffic = total unique users who passed in the search results page over a given period of time.
- If improving the homepage: Net traffic = total unique users who passed in the homepage over a given period of time.
- ⚠️ If improving the CTA on the middle of the homepage (tricky and based on experience): Net traffic = EITHER total unique users who passed in the homepage over a given period of time OR total unique users who passed by the homepage and reached the portion of the page where the CTA is visible.
6. Baseline standard deviation (σ)
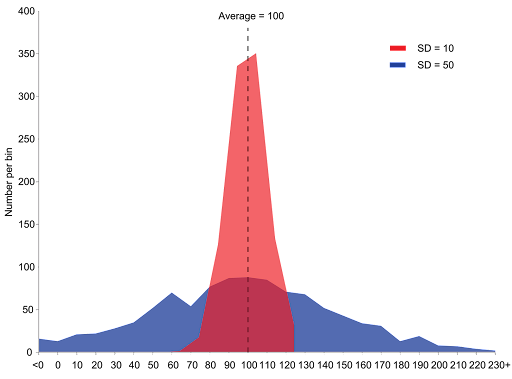
Standard deviation is a measure of dispersion in a numerical data set: how far from the “normal” (average) are the data points of interest.
It can also be said to be a measure of central tendency: the smaller the standard deviation is, the more “clustered” the data is around its center (the mean).
The larger it is, the more spread the values are.
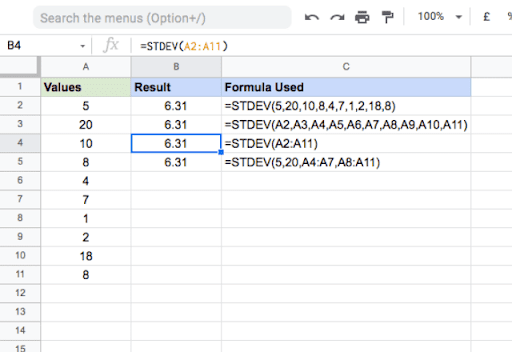
Google sheets Standard Deviation example
In most cases, you would be calculating STDEV via spreadsheet or via script. In any case, the formula below is what’s being computed under the hood.
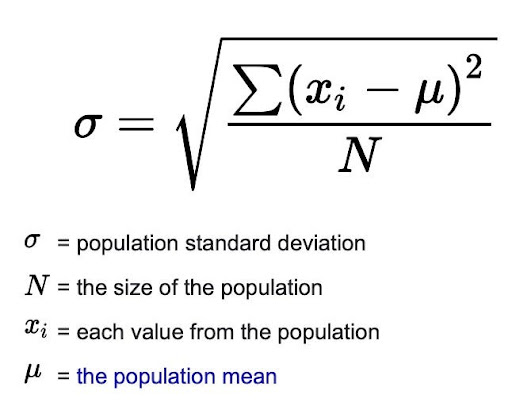
Full definition from Analytics Toolkit 👉🏼 What is Standard Deviation?
Three methods to calculate sample size for percentage based metrics
Our example — eToro landing page
An example will paint a better picture of what we’re doing before crunching numbers.
Imagine we’re part of eToro’s marketing team looking to test multiple splash pages from their Facebook paid ads acquisition growth loop. (more on growth loops here)
The campaigns are re-targeting audiences, so we’re assuming higher than average intent. The objective of the splash page is to get people to click through the next step.
The click-through rate is high, around 22.8% which we’re using on the calculations below.

Facebook ads from Facebook Ad Library

Mobile landing page
Using online calculators
I have two favorites, from CXL and Analytics Toolkit.
- CXL calculator (Free)
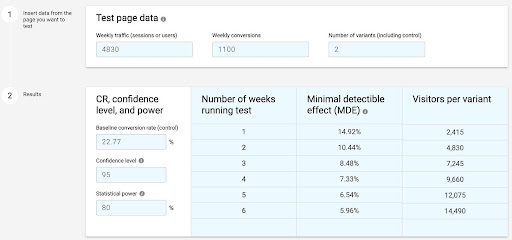
I used this one a lot because it gives you MDE in function of time.
The example above, with its baselines, would help us decide between:
- Running it for 4 weeks with a “difficult MDE” ( >= 7%)
- Going for 6 weeks with a “medium difficulty” (~ 5%)
- Analytics Toolkit calculator (Starts at $15/month)
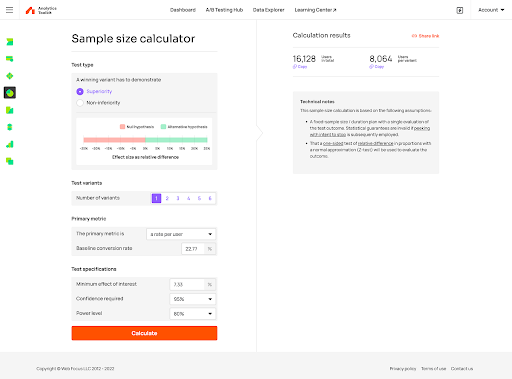
This tool is much superior in multiple ways.
- More control of parameters (e.g. superiority, non-inferiority)
- Documentation and tooltips are extremely user friendly
- I trust the statistics behind the engine with my eyes closed.
If Google Analytics or Mixpanel are part of your suite, go for this as they have native integrations.
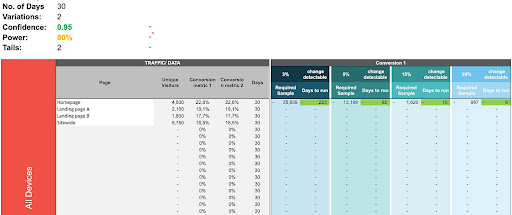
Using spreadsheets
The single benefit of having these estimations on a spreadsheet is being able to consider multiple page options at the same time for easier prioritization.
I have two favorites, from Online Dialogue and David Sanchez.
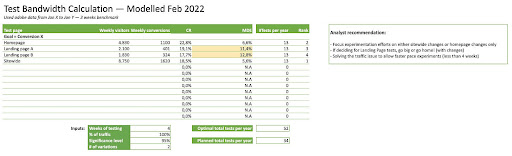
- Online Dialogue’s calculator
I attribute this one to Online DIalogue because I carry this template since the old school version of CXL’s Conversion mini degree where Ton Wesseling would walk you through this model.
- Duplicate the template for each OEC you might be considering to optimize for
- The calculator assumes 80% power
- The tests per year estimation is not awesome and I haven’t re-worked it.
- David Sanchez calculator
Disclaimer: I’m not covering the ins and outs of his calculator for the sake of briefness. Reach out to David on LinkedIn for questions!
He built his own to automate part of the operation by exporting pages in bulk from analytics and calculate sample sizes on the fly based on relevant groups of pages and templates.
The calculator uses the exact same statistical foundations as AB test guide.
His comments:

David Sanchez del Real, Senior Experimentation Specialist at iTech MediaIn most calculators you input your baseline traffic and conversion and set a length of time you’re willing to run an experiment for and you get back an MDE.
“But business doesn’t exactly work that way, and this is not super useful to calculate bandwidth. In my calculator, I use a reverse of the MDE, that is:
- I input the baselines and decide what delta is the minimum I care about.
- I get back the time it would take to run an experiment for that minimum desired outcome and that way I can assess how many experiments fit in our pipeline given our current situation.
It’s a small nuance, but it makes a difference.”
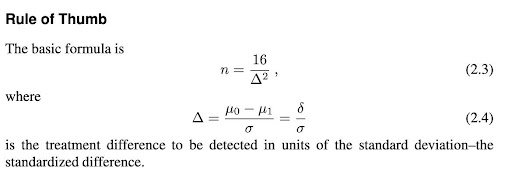
Using the OG formula
Given an OEC metric with standard deviation σ and the desired MDE Δ, that is, the amount of change you want to detect, the minimum sample size for a confidence level of 95% and power of 80% (van Belle 2008, 31) is as shown in the equation below:
Comparing against the examples for the online calculators:
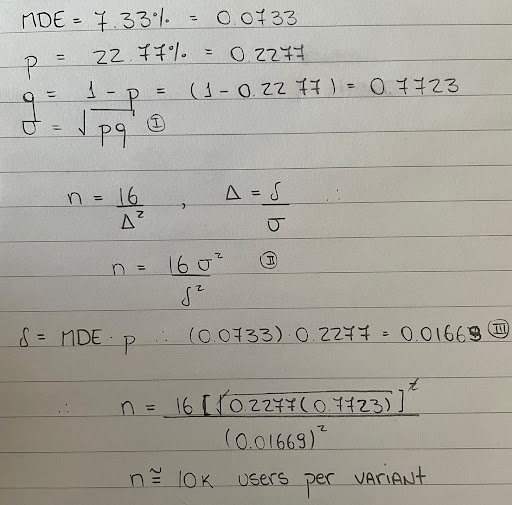
Using pen and paper was refreshing
The result lies somewhere in between CXL and Analytics Toolkit estimation.
Either way, there’s no point in running this by hand every time.
Two methods to calculate sample size for continuous metrics
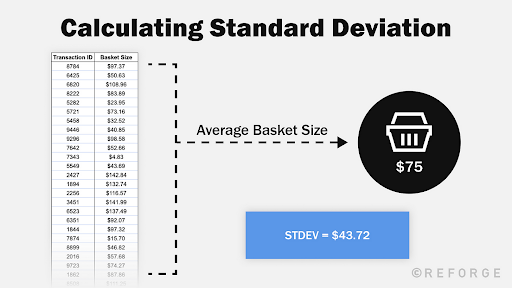
Our example — Instacart product page (from Reforge)
Now we’re part of Instacart’s optimization team looking to increase the user average basket size.
We know the average baseline for basket size to be $75 and the standard deviation $43.72
Our test hypothesis implements a recommendation system in the product page in the hopes of reaching a 2% metric lift ($1.50 MDE).
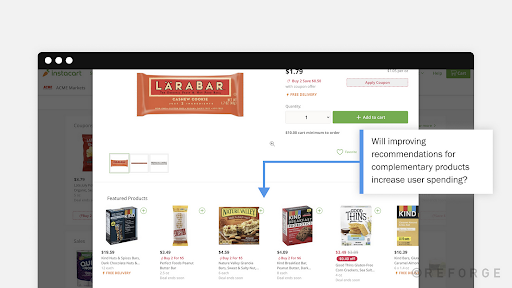
Example from Reforge Experimentation Deep Dive
Inputs for calculation
Using online calculators
Analytics Toolkit calculator (Starts at $15/month)
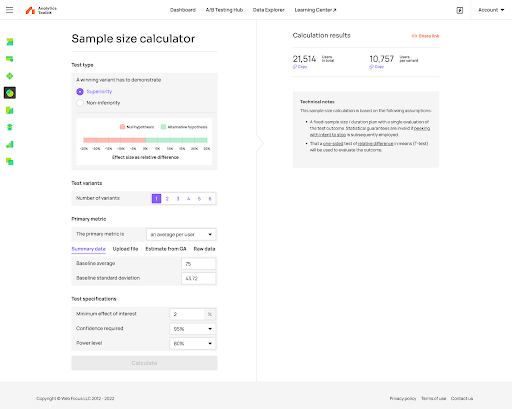
As simple as it gets.
Using the OG Formula
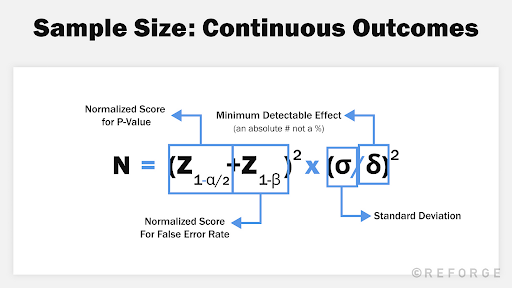
For our example, the formula suggests 6.6K users per variant, a much more optimistic assumption if compared to Analytics Toolkit’s 10.7K.
I decided not to spend time debugging the formula. For my needs, I trust and use Analytics Toolkit.
Test capacity, why does it matter?
From my experience with iTech Media, we understand capacity as a metric that helps us answer “based on the traffic levels we have, how much could we be learning from experiments?”
I believe reporting on this metric is powerful for communication purposes and to generate top-down accountability for running more experiments, especially within decentralized organizations where Product is responsible for running experiments.
Positive John, Growth Experiments ConsultantNote: This is a program-level metric that is looking to optimise for quantity not quality, and it’s ok. Most experimentation teams started by optimising for quantity (e.g., Booking.com, Microsoft.)
How to go about calculating test capacity?
After a lot of discussions about this, I still don’t have a silver bullet answer.
Why? Because it’s highly dependent on how your company operates and how experimentation works on the product.
The technicalities start at do you test only on stand-alone pages? Could you group pages or templates that have a common feature or component and test them in aggregate?
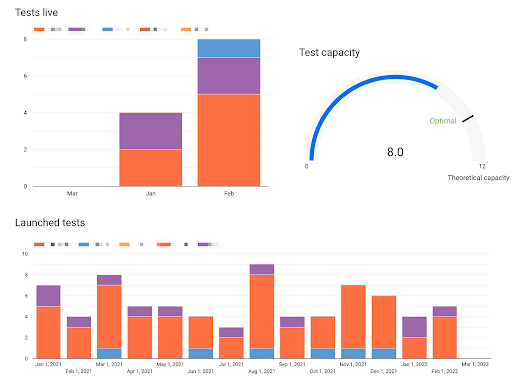
The way I do it and recommend others to do is the following:
- Use spreadsheet calculators to analyze test capacity for your main OEC across multiple pages. Consider the sum of capacity your “theoretical capacity.” Update this metric on a quarterly basis.
- Monitor both tests launched and tests live by the end of each month.
- Report on bandwidth usage based on theoretical capacity / tests live by the end of the month.
- Report and hold accountability for “optimal capacity” based on test live historical data. This is a subjective measurement and it evolves with the intuition of the experimenter.
Frequentist vs Bayesian

If I have to choose I’m a Bayesian thinker and I suggest you consider the same.
I believe Bayesian analysis provides much clearer language to explain experimental results.
With the simplistic Bayesian framework I use with my product teams (read more here), updating can be seen as an alternative for a sample-size determination that does not require specification of the effect size under the alternative hypothesis.
There are white papers that attempt to calculate a sample size for Bayesian testing, I don’t do it.