Growth Metrics Every SaaS Business Should Track
Between the vast variety of analytics platforms and a seemingly endless number of metrics to track, it can be difficult to find the signal through the noise.
- What growth metrics to track?
- What’s important?
- What matters?
It’s all too easy to spend time tracking metrics that actually aren’t helping you make important decisions to grow your SaaS.
Without context or comparison, metrics are often useless and thus called vanity metrics. Vanity metrics are easily manipulated and don’t actually help you grow your company. Metrics like website sessions, Twitter followers, and email subscribers, may make it seem like you’re making progress or doing the right thing, but in reality don’t necessarily correlate with revenue growth, which is the ultimate goal of your business.
In this article, we take a look at how growth metrics help you make better decisions for your business, and the 8 top metrics you should be tracking.
What are growth metrics for?
Because we don’t want to track vanity metrics, every growth metric must help you answer one or more of the following questions:
- Is my business financially viable?
- What’s working well?
- What needs improvement?
- What should we focus on that will push the business forward?
Growth metrics for SaaS and subscription-based businesses differ vastly from one-time sales and transaction-based businesses. Because revenue is recorded and collected over time instead of upfront, there has to be a heavy emphasis on retention. Thus, many of these metrics are focused on retention, as well as customer acquisition.
Whether you are trying to improve your revenue growth or reviewing a SaaS business for sale, these 8 growth metrics are extremely crucial.
Related: Learn more about SaaS reporting and its importance
Lead Velocity Rate (LVR)
Your first goal is to continually increase the number of qualified leads generated.
Lead Velocity Rate is a measure of growth in qualified leads for one month versus a previous reference month. When measured from month-to-month, LVR can be a powerful predictor of the business trajectory, in terms of both revenues and user growth.
Other metrics (even ones we’ll discuss below) tend to belagging indicatorsin that they’re unreliable in predicting business growth because they’re heavily influenced by other inputs.
Lead Velocity Rate, on the other hand, is a current, real-time measure of actual sales performance, especially when it is measured based on qualified leads. In general, if Lead Velocity Rate is used as one of the primary KPIs of your sales organization and is consistently met on a monthly basis, it is a strong indicator of your sales efficiency and the future business growth.
Because of the predictive nature of Lead Velocity Rate, it makes for a great growth metric to track and forecast revenue growth.
How to calculate Lead Velocity Rate
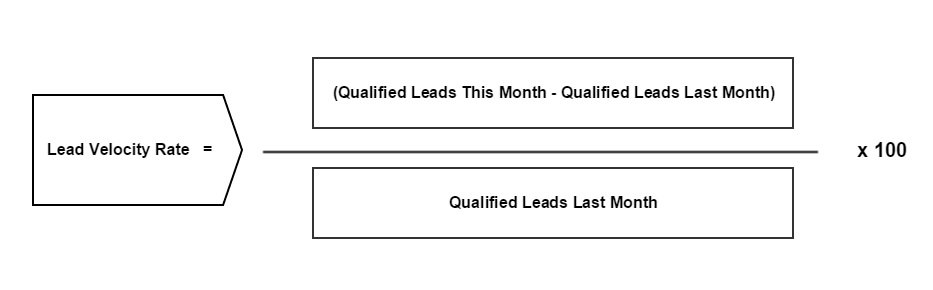
Calculating Lead Velocity Rate is as straightforward as calculating percent growth:
Lead Velocity Rate = (No. of Qualified Leads This Month – No. of Qualified Leads Last Month) ÷ No. of Qualified Leads Last Month x 100
So if you have 11 qualified leads this month and 10 qualified leads in the previous month, your current Lead Velocity Rate is at 10%.
(11 Qualified Leads This Month – 10 Qualified Leads Last Month) ÷ 10 Qualified Leads Last Month x 100 = 10%
Lead Conversion Rate
In a similar vein, the number of qualified leads that convert into paying customers is also crucial for your business’ ability to grow.
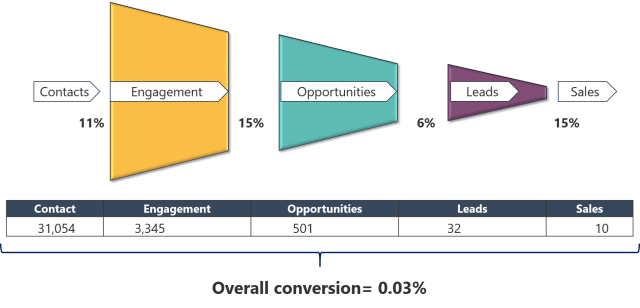
Lead Conversion Rate is a measure of how many leads converted into customers, usually within a rolling 30 day period. What makes a good lead conversion rate is going to vary based on the model of your business. For example, a freemium app may have a very low lead conversion rate compared to an app with a free two-week trial.
But that shouldn’t deter you from measuring it intentionally and working to improve the number of leads who become customers. This can be done via a better onboarding experience, educational content, triggered emails, product tours, and other strategies to help leads find and leverage the value of your app.
When you have a decent number of leads coming in, improving the conversion rate can go a long way to moving the needle and ensuring you’re making the most of every customer experience.
How to calculate Lead Conversion Rate
Calculating Lead Conversion Rate is straightforward as long as you have the right timeframe:
Lead Conversion Rate = (No. of New Customers in the last 30 days ÷ No. of Leads in the last 30 days) x 100
So if you had 12 new customers in the last 30 days and 100 leads in the last 30 days, your current Lead Conversion Rate would be at 12%.
(12 New Customers in the last 30 days ÷ 100 Leads in the last 30 days) x 100 = 12%
Monthly Recurring Revenue (MRR)
Monthly Recurring Revenue, commonly abbreviated as MRR, is all of your recurring revenue normalized into a monthly amount. It’s a metric usually used among subscription and SaaS companies.
The key difference between MRR and Net Revenue is that MRR is normalized, meaning it’s a representation of revenue, not what’s actually being collected. Net Revenue is the revenue actually collected.
Net Revenue could be higher or lower than MRR depending on the billing terms and schedule of your plans. For example, a month with a particularly high number of signups to an annual plan would cause Net Revenue to be higher than MRR, which is normalizing the annual plan to a monthly amount.
Recurring revenue is the lifeblood of any SaaS. It’s what makes building a SaaS so appealing. You don’t have to worry about one-off sales that may or may not return. If you’ve got a solid product, they automatically return. Every. Single. Month.
In general, it’s a straightforward metric, but there are some nuances that you’ll want to take into consideration depending on your business model.
How to calculate MRR
Calculating monthly recurring revenue on a high level is straight forward:
MRR = No. of Customers x Average Billed Amount
So 10 customers paying you an average of $100 per month would mean an MRR of $1,000.
10 customers & $100/mo = $1,000 MRR
And if you want to calculate what your Annual Recurring Revenue (ARR) is, just multiply your current MRR by 12.
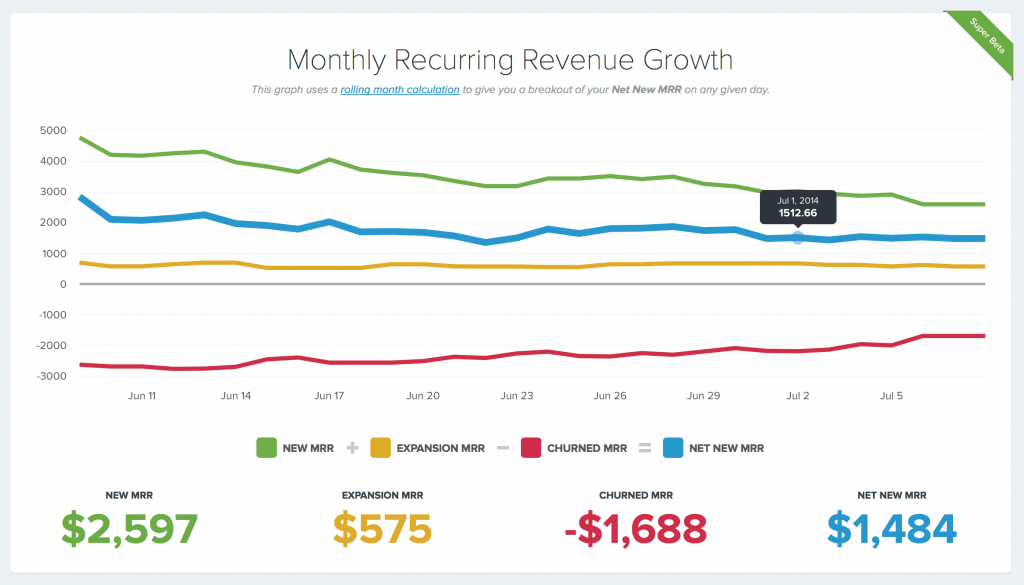
How to calculate how much new monthly recurring revenue you have
As your business grows, it will become important to track not only your top-level MRR but also what factors make up the change in your MRR over previous months.
If you added $1,000 in new MRR, you’d want to know where that came from, right?
Lucky for you, that also is relatively easy using 3 elements that makeup what we’ll call“Net New MRR“.
- New MRR:Additional MRR from new customers
- Expansion MRR:Additional MRR from existing customers (also known as an “upgrade”)
- Churned MRR:MRR lost from cancellations or downgrades
Net New MRR = New MRR + Expansion MRR – Churned MRR
Churn Rate
Churn refers to the number of customers or subscribers who stop using your service during a given time period. Your annual churn is the percentage rate at which you are losing your users. Those customers who have stopped using your service have “churned.”
Even a small churn rate can have a major impact on your revenue over time.
dvice/wp-content/uploads/2020/03/ChurnRate.png
The compounding effects of churn rate can have a massive impact over a long period of time
While churn is inevitable—you will lose users, just as you will gain them—it is a key figure to have in mind as you plan for your company’s expansion.
Churn is often overlooked because it’s assumed that bringing in more new customers should cancel out its effects, but the reality is that a high churn rate is unsustainable and has compounding effects over time. It’s also indicative of potentially deeper rooted problems like product/market fit, onboarding, pricing, or customer expectations.
How do you calculate churn?
There is more than one way to measure your churn. Churn is typically presented as a percentage of either revenue or customers lost in a given time frame.
User churn represents the number of customers lost during a given time period, whereas revenue churn represents the revenue lost to user churn during a given time period. Since revenue is the ultimate goal, it could be argued that revenue churn is more important and should be the true point of focus.
User Churn= (Cancelled Customers in the last 30 days ÷ Active Customers 30 days ago) x 100
Revenue Churn= (MRR Lost to Downgrades & Cancellations in the last 30 days ÷ MRR 30 days ago) x 100
For example:
A 5% User Churn Rate means that 5% of the total customers you had 30 days ago have canceled within the last 30 days.
A 5% Revenue Churn Rate means that you lost 5% of your MRR as it stood 30 days ago to churn in the past 30 days.
A good rule of thumb to follow is that a business generally needs to have churn in the single digits, e.g. 9% and under. Ideally a business will have a churn rate under 5%, but a higher churn rate can be managed with enough new customers and expansion revenue.
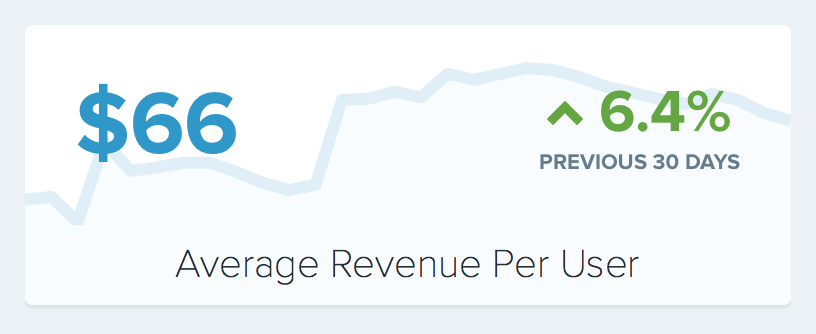
Average Revenue Per User (ARPU)
Average Revenue Per User (or ARPU, the most fun acronym to say) is the measure of how much revenue you’re generating for each active customer. To calculate it, divide your MRR by the total number of active users that month.
ARPU = MRR ÷ Active Customers
Measuring ARPU helps startups scale. If your ARPU is low, you’ll be more affected by support and infrastructure issues. For example, if each customer is only paying $5 per month, you don’t have much extra revenue to grow. The cost of that customer calling into support will consume their entire monthly fee.
ARPU dictates your growth strategy in many ways. Low ARPU means you’ll need to acquire a ton of customers to hit $1M ARR. It also means you won’t be able to offer expensive phone support or spend a lot of money on customer acquisition. If you spend more money on the customer than they pay you, you will go broke.
Tracking your ARPU also helps you understand your customer’s preferences. If more customers choose your higher priced plans, you’ll see your ARPU increase.
There are two ways you can increase your ARPU. Either increase the average plan size customers sign up for (i.e. upgrade customers to a higher tier), or upsell them with add-ons and expansions.
Higher plans:As you continue to add features to your product, you’ll want to continually analyze your plan packages. Can you put together a higher price point plan that will entice more customers? Are you giving away too much with your lower-end packages? Customer interviews can be really helpful in determining why they chose one plan over another.
Add-ons:You may also choose to make some features available on their own, outside of plans. Whitelisting, additional storage, and premium support are all examples of great upselling opportunities. Even a few extra dollars a month per customer gives you additional revenue to support them better.
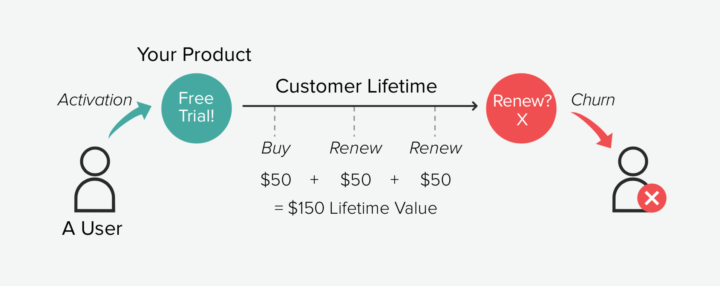
Lifetime Value (LTV)
Lifetime Value is the predicted amount a customer will spend on your product or service throughout the entire relationship, hence “lifetime.” This metric can help you move from transaction-based thinking to focusing on the long-term value of repeat business.
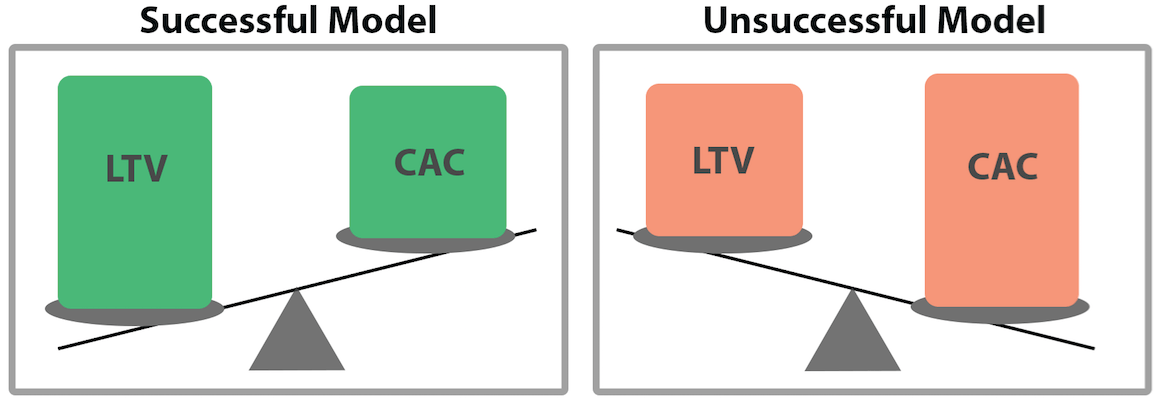
Lifetime Value is an important metric, especially when matched with Customer Acquisition Costs (CAC), which we’ll cover in the next section. If you know how much a customer’s value will be over the course of a lifetime, then you can make smarter decisions about what to spend to acquire a customer. A good rule of thumb is that if LTV/CAC isn’t above 3, you’re spending too much on acquisition.
How do you calculate LTV?
To calculate LTV, we’ll actually need a couple of other metrics: User Churn and ARPU.
LTV = Average Monthly Recurring Revenue Per Customer ÷ User Churn Rate
With this in mind, you can improve LTV by improving either user churn or ARPU.
User churn can be improved by either reducing the number of customers that churn or by maximizing the time a customer is with you. This is where annual plans come in handy. ARPU can be improved by either charging more, upgrading customers to more expensive plans, or by offering add-on features and products.
Customer Acquisition Cost (CAC)
t’s a simple rule of business that you want to make more money than you spend. It follows that it’s important to know how much money you’re spending.
Money that’s spent on convincing a customer to make a purchase is called the Customer Acquisition Cost (CAC). In order to be profitable, at the simplest level, customer acquisition cost will need to be lower than their lifetime value as a customer. You need to make more money than you spend acquiring the customer.
The easiest method of calculating CAC is to add up all the expenses of acquiring a customer and divide it by the total number of new customers. Expenses include costs at every stage of the funnel, ie. marketing salaries, PPC campaigns, sales executives, etc.
CAC = (Total Marketing Expenses + Total Sales Expenses) ÷ No. of New Customers Acquired
What do you track CAC for?
CAC generally serves two purposes:
- Understand the maximum you could afford to acquire a customer
- Work to decrease CAC in order to increase acquisition efficiency and profit
Given how much marketing budget you have to work with and how quickly you need to make your money back from acquiring a customer, you can use the LTV/CAC ratio to understand the most you’d be able to pay to acquire a customer.
A 3:1, 4:1, or 5:1 ratio are generally accepted to be good LTV/CAC ratios to grow your business.
This can help you choose and invest in the acquisition channels that make the most sense for you.
But that’s not the whole story.
The CAC payback period is the number of months it takes for your company to earn back what was spent on acquiring your customers. Think of it as your break-even point and a great indicator of how much cash the company needs in order to continue growing profitably.
In order to calculate your CAC payback period, you’ll need to know your CAC, ARPA (Average Revenue per Account) and Gross Margin percent. From there, you’ll divide your CAC by your ARPA multiplied by Gross Margin percent:
CAC Payback Period = CAC ÷ (ARPA X Gross Margin Percent)
Understanding this key benchmark will not only help you determine how much cash flow you will need to be profitable, but may also indicate the need for cutting costs in the marketing funnel if the payback period is long and users are churning before you’ve earned that initial investment back.
Quick Ratio
The Quick Ratio of a SaaS company is the measurement of its growth efficiency. It helps you answer the question, “How reliably can a company grow revenue given its current churn rate?” As with all metrics, there’s a big hairy asterisk that needs to be appended whenever we talk about what a metric “should” be or what’s “best”.
But first, let’s talk about how to calculate the Quick Ratio for your SaaS company.
To calculate your Quick Ratio you simply divide gained MRR by lost MRR. A Quick Ratio above 1.0 means the company is growing, whereas a ratio below 1.0 means the company is contracting. The higher the ratio, the healthier the growth is at the company.
Quick Ratio = (New MRR + Expansion MRR + Reactivation MRR) ÷ (Contraction MRR + Churned MRR)
All MRR growth is not created equal. The types of MRR that make up your MRR growth really do matter.
- New MRR:MRR from new customers
- Expansion MRR:MRR from existing customers (upgrades)
- Reactivation MRR:MRR from churned customers who reactivated their account
- Contraction MRR:Lost MRR from existing customers (downgrades)
- Churned MRR:Lost MRR from canceled customers
Say a company has $10,000 in MRR growth. That growth could be made up of any combination of those types of MRR, and the Quick Ratio shows you the difference in “growth efficiency” between them.
The Quick Ratio arguably provides the clearest picture of a company’s health. A Quick Ratio less than 0.9 is contracting and should be focusing entirely on improving this metric to something more sustainable. A Quick Ratio between 0.9 and 1.1 has relatively flat growth, and should be focusing on getting above and continually increasing above 1.1. A Quick Ratio more than 1.1, ideally in the 1.3 to 4.0 range is experiencing very healthy growth and should be focusing on scaling and optimizing efforts to sustain this Quick Ratio.
Putting these metrics into action
These metrics should be reviewed on a daily, weekly, and monthly basis to ensure you’re on the right track to hit your goals.
“What gets measured gets improved.” — Peter Drucker
Without regular check-ins, you may experience major changes that can drastically alter the future of your business. A decline in signups, an increase in cancellations, and customers downgrading accounts all happen over time and can go unnoticed until it’s too late.
Keeping a close eye on these 8 metrics will help you spot patterns, track improvements, and strategize about what to focus on. You might even use them as a starting point to digging into your user base to do some more thorough customer research so you truly understand the context behind the metrics you’re looking at. A daily check in helps you spot granular changes and what’s actually helping improve metrics. Weekly and monthly check ins help you understand the trajectory you’re on and plan for the future.
The next time you’re wondering how your business is doing, what’s working, what needs improving, and what to focus on next, these 8 metrics will help you clearly answer those questions.