The Minimum Viable Creative Testing Process
Most of the advice you’ll get on creative testing is meant for big accounts, spending upwards of $1 million a year on advertising. If you ask an expert, the reason they’ll give you is that you need a lot of data before your experiments become statistically significant.
However the vast majority of advertisers are small. Meta makes over $100 billion in advertising revenue, but if you divide that by 10 million active advertisers, it works out at $10,000 per year, per advertiser. If you’re closer to $10k than $1m, you may be wondering how you go from small to big, when you can’t test and learn what works?
I’ve worked with over 200 smaller advertisers, ran 8,000+ experiments, and wrote a book on creative testing, so I’ve developed practical ways to deal with this issue. The key to beating the limitations of statistical significance is understanding that it’s not just a function of how much data you have. The number of variations of creative you’re testing, and the potential size of the impact of a successful test matter as well.
Using Test Duration Calculators To Ensure Statistical Significance
Let’s take a look at an example and you’ll see what I mean. Whenever you plan to run an experiment, it is important to calculate how long it needs to run to reach statistical significance. If you Google for “test duration calculator”, you’ll find a tool like VWO’s Test Duration Calculator, where you can just plug the numbers in, without the need for knowing the formula.
Let’s imagine we’re a small startup trying to improve performance in our Meta account through creative testing. We worked with a designer and copywriter on our creative strategy, and managed to produce 3 new image variations and 5 new text variations, for the 2 main audiences we’re targeting. Testing each one of these in combination will give you 30 test variants.
3 Images x 5 Adcopies x 2 Audiences = 30 Variants
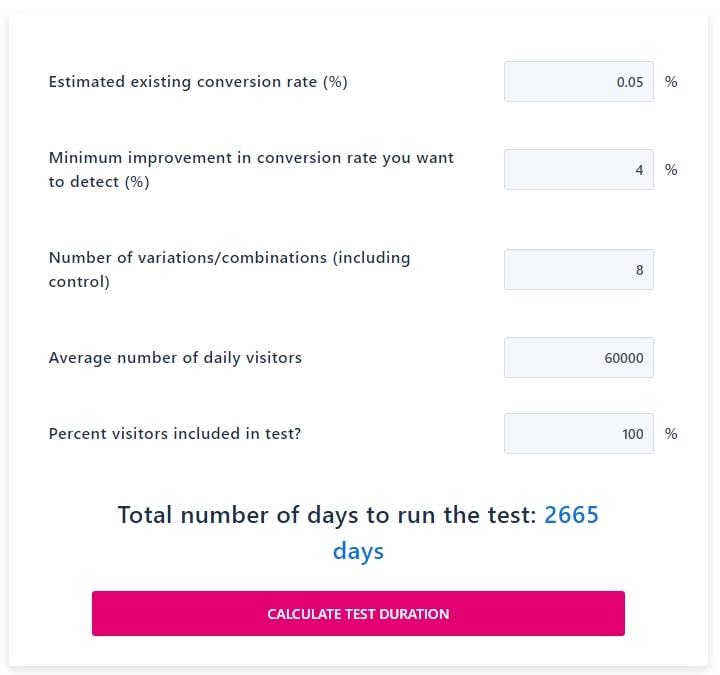
Now let’s say we spend $30 per day (~$10k per year) at an average $10 CPM (cost per 1,000 ad impressions), that’s 30,000 impressions per day you can expect to serve. We want to be conservative with our budget, and only set 20% aside for testing: the rest will be business as usual. We’ll judge the test based on what gets the most conversions, and so we need our CTC (click-to-conversion rate), which historically has been 0.05% (1% of people who see the ad click on it, and 5% of them end up purchasing). The average A/B test gives a 4% lift in performance, so let’s plug these assumptions into our calculator and see how long our test will take to run…
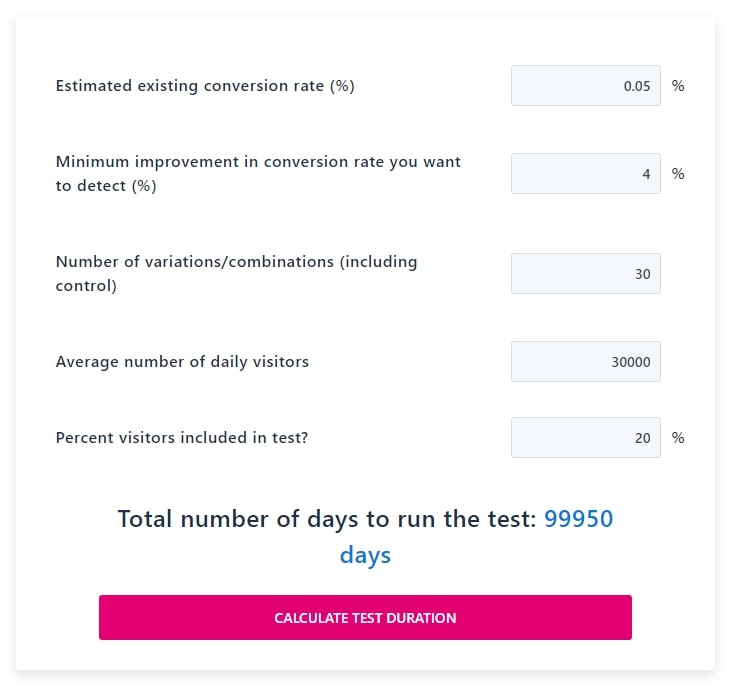
It’s going to take over 270 years to run our experiment at this rate! No wonder they warned us small businesses shouldn’t bother running tests. What are some practical ways to bring this number down? All of those fields are modifiable, so let’s work from bottom to top to see how they affect the test duration.
1. Allocate Budget More Aggressively To Testing
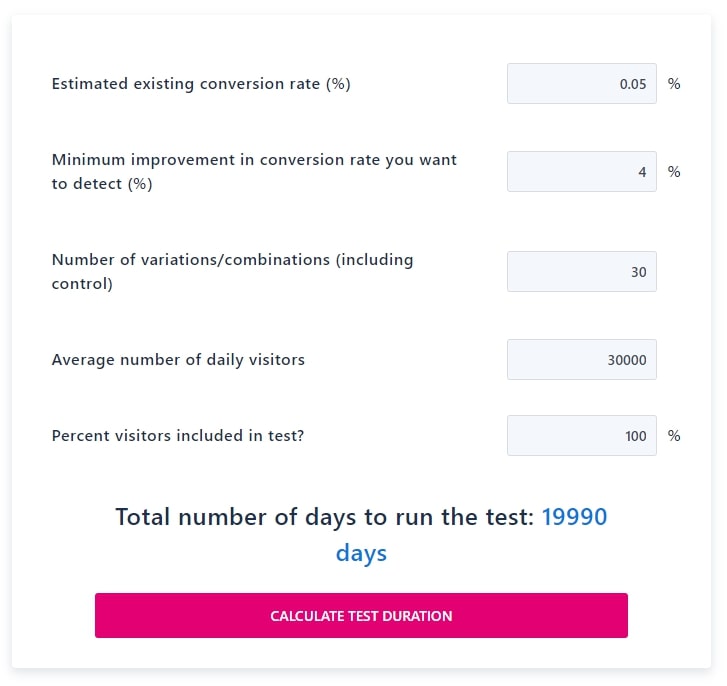
We were conservative before, setting aside only 20% of our budget for testing. However the situation we’re in calls for more aggression. If we don’t figure out ads, they’ll be turned off. If we can’t make ads work, and can’t find an alternative growth channel, we might lose our job or even go out of business altogether! Until our performance is good enough, we don’t really have anything to protect. So let’s turn up the “Percent visitors included in test” and use 100% of our budget on testing. That gets us to 54 years, still a ways to go.
2. Get More Budget Approved For Faster Learning
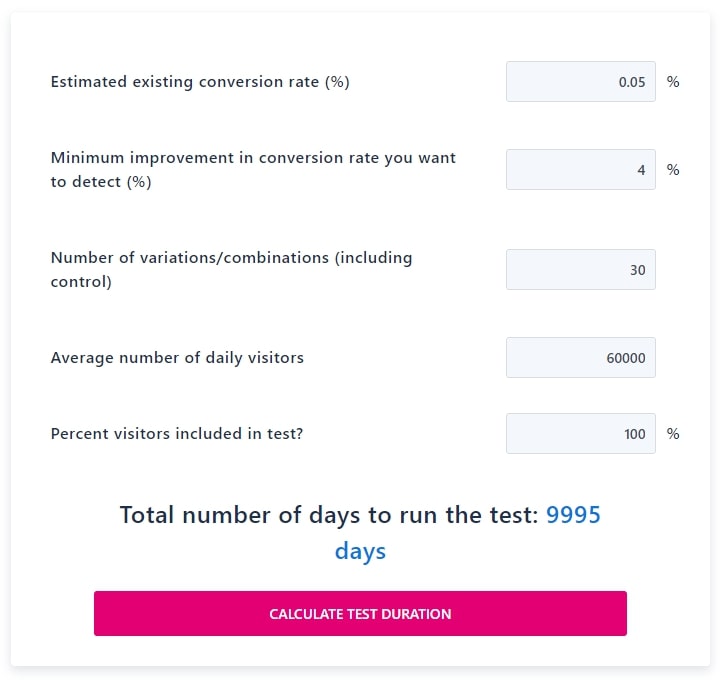
We might not be able to increase our budgets significantly without proof we can drive more growth, but there’s probably some wiggle room. Remember if we don’t get results in time, we’ll probably have to switch off ads altogether. Most managers will see the logic in spending more for a short period of time to run a proper test. Double the budget to $60 a day by modifying the “Average number of daily visitors” field – where we input the number of daily impressions – to be 60,000, and the test would be over in 27 years. Still not good enough.
3. Decide What We Really Need To Learn
Do we really need to test 30 variations? Not every ad copy will work with every image, so it’s likely we can eliminate a few variations before we start. We can also use advanced techniques like Orthogonal Arrays to slim down our test parameters. However we’ll make the most progress by zooming out and testing at a higher level. Separate your creatives into concepts, themes, and variants, and save our valuable split test slots primarily for new concepts. Anything we eliminate can still be used later on, but we’ll just load them into an existing campaign and let Meta optimize, accepting the risk they may not get shown.
For example if one of the new images we made was of a new product line or feature, it may be existentially important to test it. Whereas the ad copy may be small variations on existing themes, and we don’t have to be rigorously scientific. We also shouldn’t care that much about one audience over another, as the best ad for one is usually the best for all. If we eliminate all but 4 of our variations (2 images x 2 ad copies = 4 variations), and update that figure in the “Number of variations/combinations” field, we’re down to 3 and ½ years.
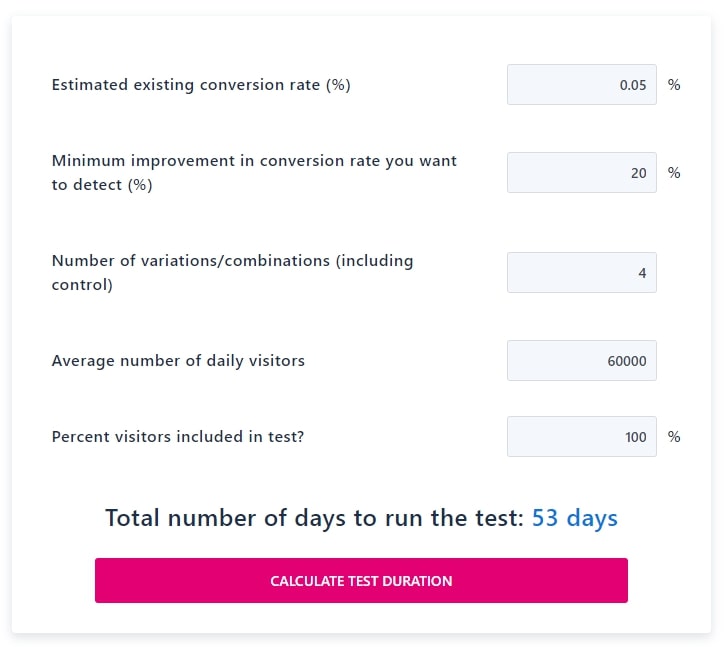
4. Focus On Making Bigger Bets With Your Tests
It would be great if we had as much traffic as Google and could test 41 different shades of blue, but we’re not. We can’t even afford the average performance uplift, so we have to make bigger bets. Thankfully we already eliminated our least important test variations, so we get to update this assumption. Remember that we can’t know how these tests will perform: if we did there would be no reason to test in the first place! However we can estimate the relative magnitude based on experience: adding a red border might yield +1% whereas a whole new feature or product line could be more like +20%. Updating our assumption in the “Minimum improvement in conversion rate you want to detect” field finally gets us to a more reasonable 53 days.
5. Optimize To Actions Higher Up The Funnel
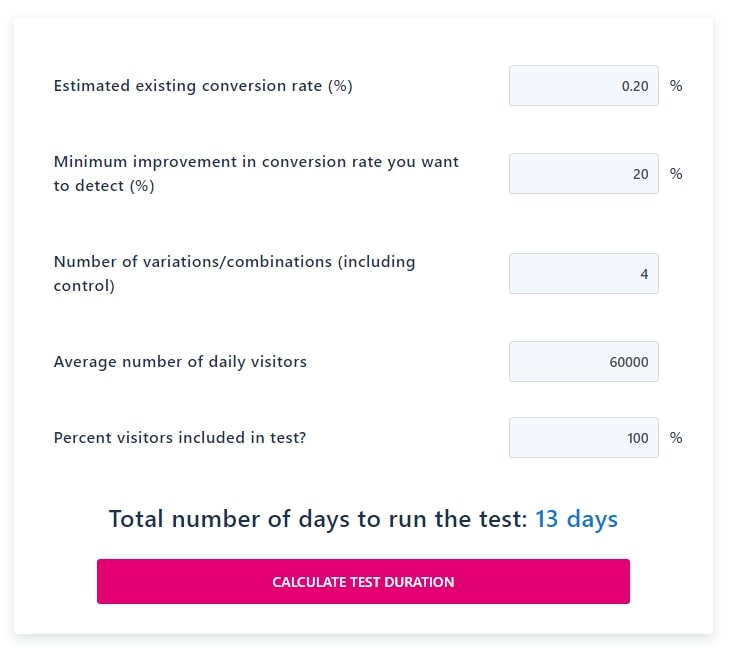
We said at the beginning that statistical significance is a function of how much data you have, but also how many variations you’re testing, and the potential size of the impact of a successful test. Now that we’ve dropped as many variations as we can, and we’re only testing really big changes, the only thing left is increasing the amount of data. We’ve already doubled our budget so there’s no more wiggle room there. However we can change the metric we’re optimizing to.
Before we said our CTC rate (Click-to-Conversion) rate was 0.05%, because 1% of people click and 5% convert. However there might be an action further up the funnel, say a registration step, or adding a product to cart, that isn’t a full conversion but is a good indicator of a successful visit. By definition, any event that’s higher up the funnel has a higher conversion rate, improving our CTC rate assumption. If 20% of people take the preceding step in the conversion funnel versus 5%, now we can plug 0.2 (1% x 20% = 20%) instead of 0.05 into the “Estimated existing conversion rate” field. We can even go one step further and optimize just to clicks, but we run the risk of selecting a creative that doesn’t convert. In any event it’s not needed: with this latest modification we can now run an experiment of this size every two weeks.
Related: Learn more about funnel analysis to optimize growth by Nick Schwinghamer
How To Make Tradeoffs When Designing Your Experiments
We started with an impossible 270 year test cycle, and ended up with a manageable 2 week sprint. We did this by thinking about the bigger picture when designing our test: being disciplined about what we really needed to test, and trading that off against the reality of our resource constraints. This combination of inputs we used in our test duration calculations worked for the example company, but every company is different. Some actions and schedules will be more or less economically and politically acceptable in your company depending on many factors: the culture, the size of the company, how senior you are, the importance of the channel, and how much performance needs to improve.
I recommend playing around with these inputs as much as possible, so you get a feel for what makes a difference, and what feels comfortable to choose. Try to use real data wherever possible, and don’t be too rosy with your assumptions if not: it’s easier to explain a string of unexpected wins than a series of insignificant results. Eventually you won’t even need the calculator, because you’ll have intuition about what inflates the cost of a test. The important thing is that you’re forced to make assumptions and tradeoffs, instead of engaging in magical thinking that all of your tests are going to succeed and your performance will skyrocket. Growing a business is about making tough decisions with uncertain information, but you can be smart about what you remain uncertain about.
Want to speak with Michael?